Ancillary Tools
Vapor comes with a Tools menu that provides utilities that can help with visualization and analysis.
Python Engine
The Python Engine is a tool that allows users to derive new variables based on the data that exist in their files. Users need to select input variables that will be read in their script, and they will need to define an output variable. If the script successfully run by the Python Engine, the output variable will be usable in the same way as the native variables are in the dataset.
The modules numpy and vapor_utils are available for importation in the Python Engine.
Note: Input variables must exist on the same grid to produce a valid output.

2D Plots
Users can generate two-dimensional line lots of their variables using the Plot Utility. Line plots can be done either through two points in space at a single timestep, or through a single point across a timespan.

The user interface for hte Plot Utility
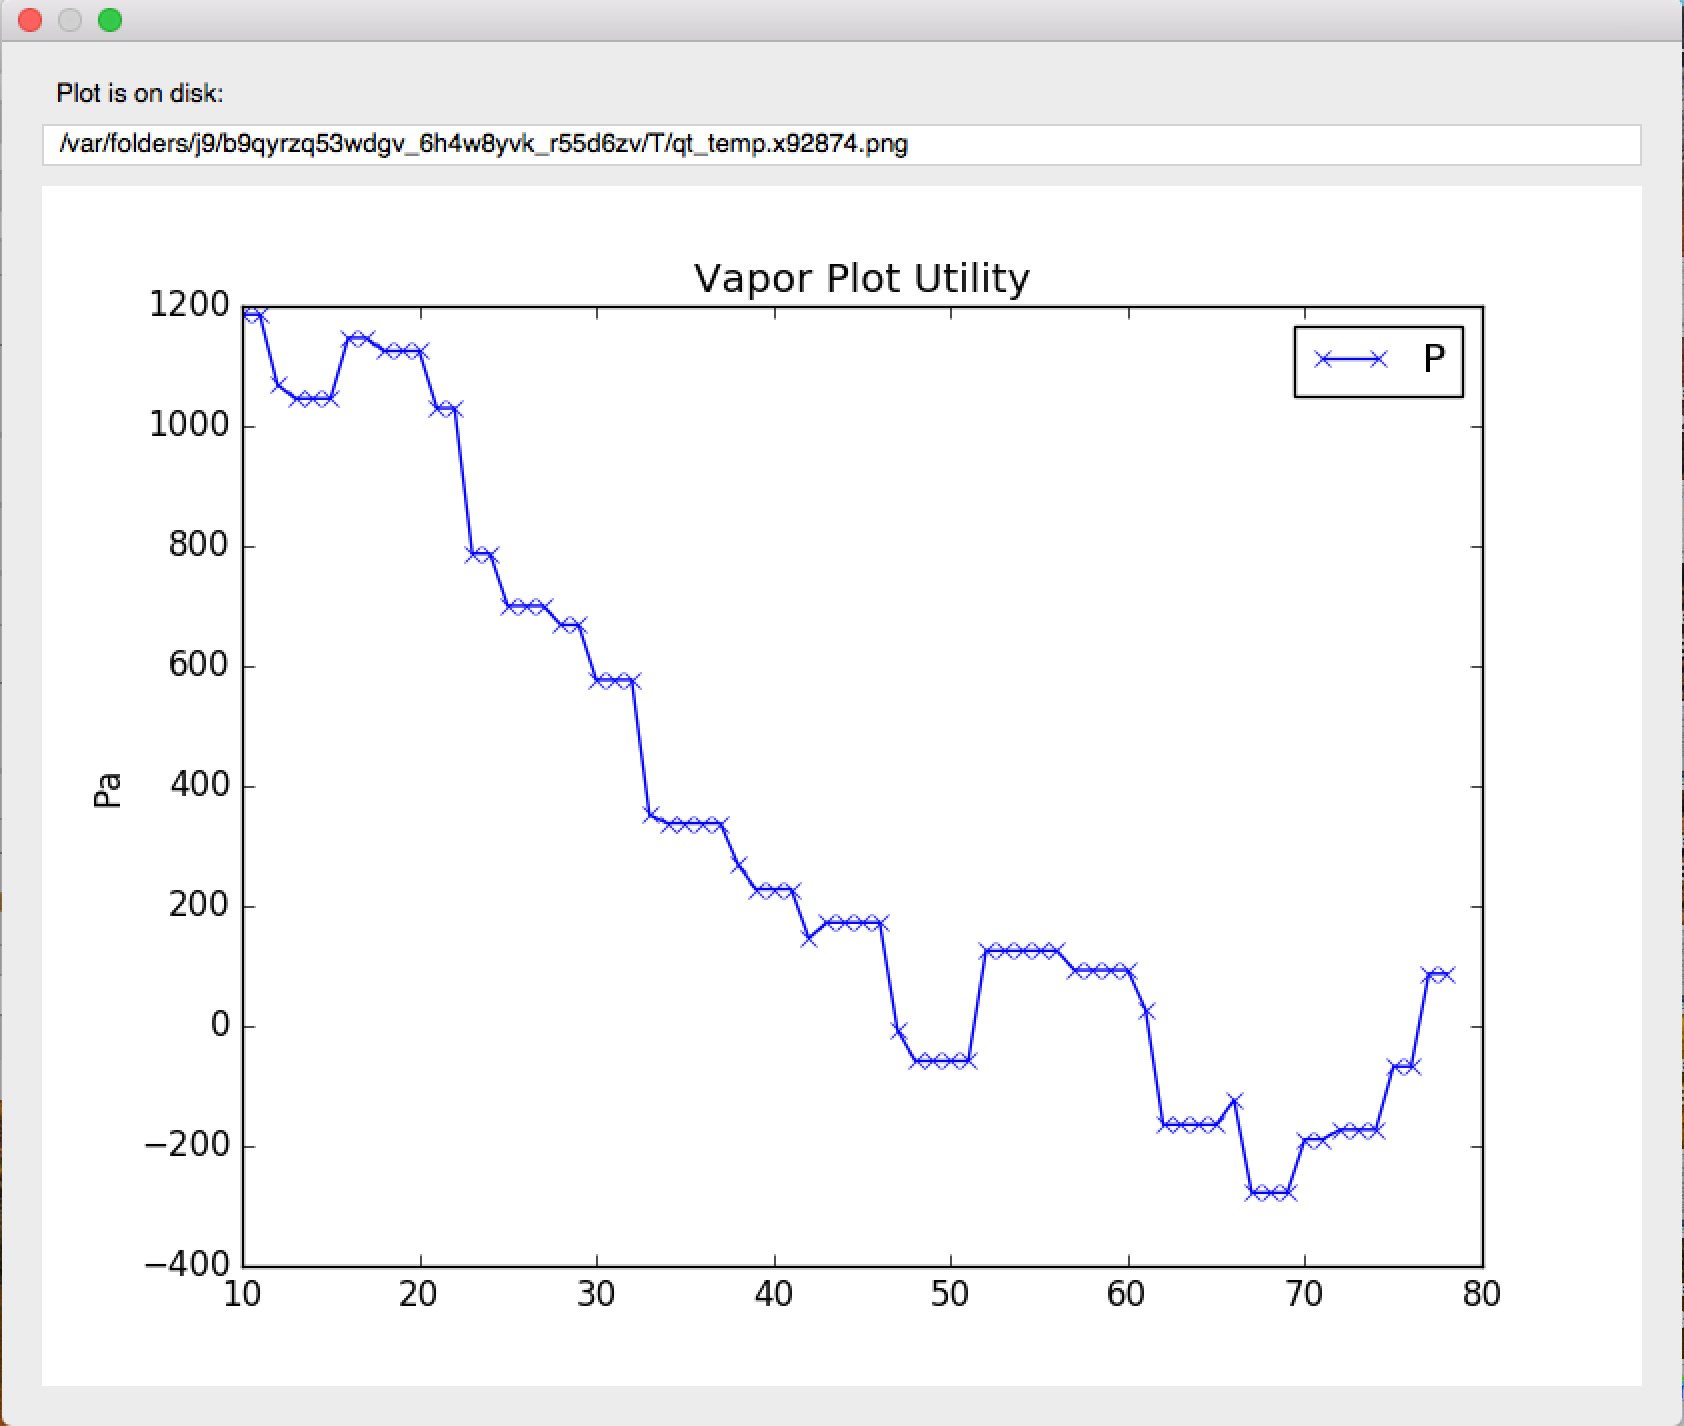
An example of a line plot of Pressure through the spatial domain, at timestep 0
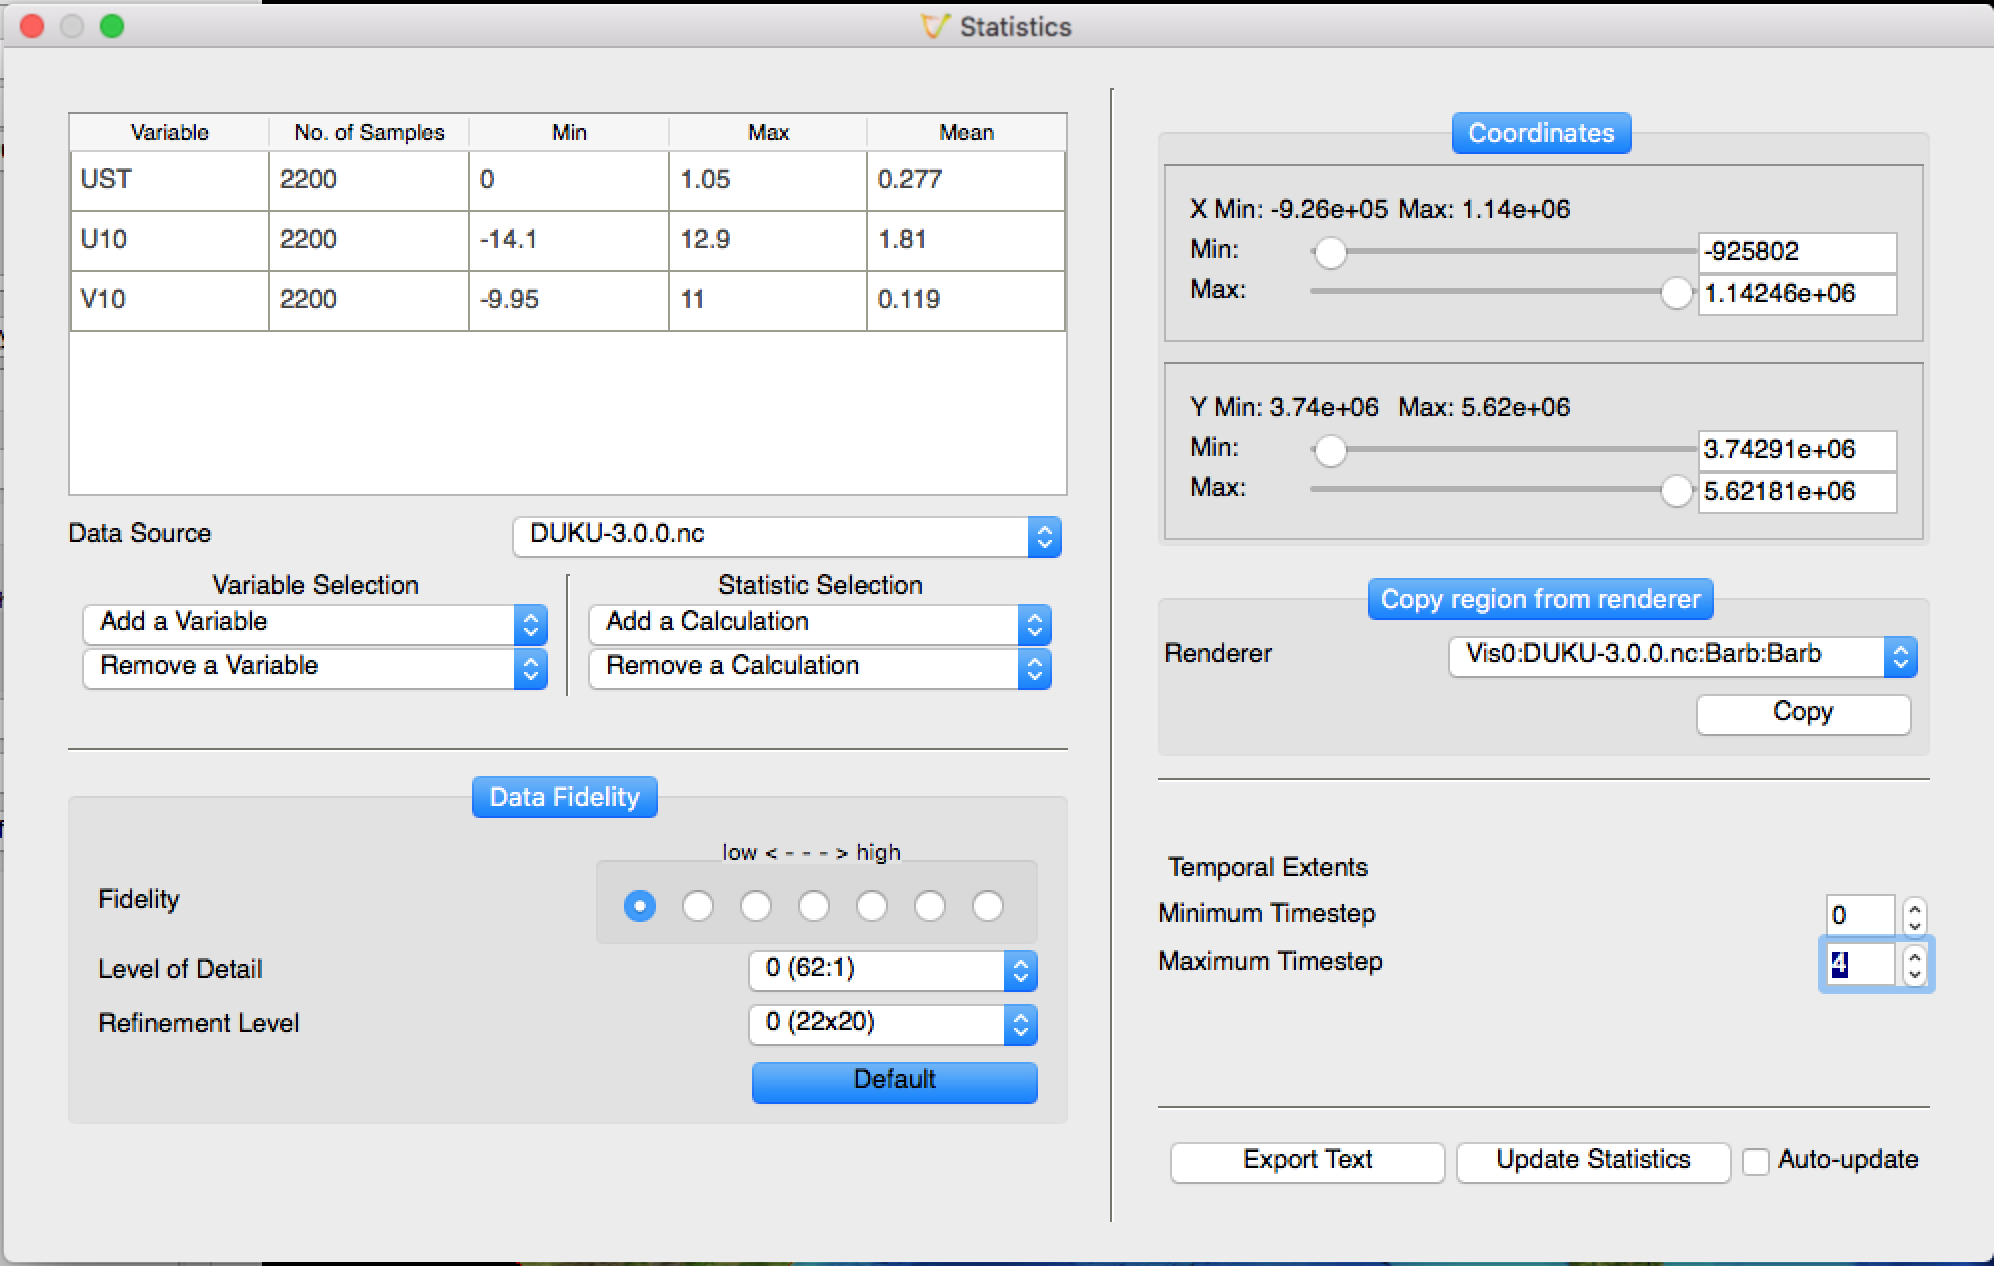
Statistics
Statistical values can help users select meaningful values for renderer color extents, isosurface values, and contour values. Vapor currently supports calculating the minimum, maximum, mean, median, and mode for variables. The spatial and temporal extents of the variables being queried are adjustable by the user.